SQL Server has a bounty of self-diagnostic data that any good DBA can monitor and analyze. This analysis is often triggered by an unexpected event like queries that begin to run longer than usual or a spike in CPU utilization. Finding the root cause of such events is not always easy but through a simple process of deduction the answer is almost always available. While the DBA may ultimately have to sift through and correlate data from a number of different sources such as performance counters, blocking and locking information, error logs, the plan cache, etc, a good place to start is with wait statistics.
DMV for Wait Stats
Wait statistics or “wait stats” as they are generally called are measurements of how long a thread in a SQL Server process has to wait on a resource. There are hundreds of categories of wait types, many of which can safely be ignored because they are monitoring system processes that are always going to accumulate waits over time. But there are many that you will want to watch out for as they could be indicators of a larger issue that will need to be further investigated.
Microsoft has made it very easy to see the wait statistics that are accumulating on your SQL Server instance. Everything you need is in one Dynamic Management View (DMV) called sys.dm_os_wait_stats. Below is a simple query that returns the results of 5 of the most common wait types from this DMV.
SELECT [wait_type],
[waiting_tasks_count],
[wait_time_ms],
[max_wait_time_ms],
[signal_wait_time_ms]
FROM [master].[sys].[dm_os_wait_stats]
WHERE wait_type IN ( ‘CXPACKET’, ‘ASYNC_NETWORK_IO’, ‘WRITELOG’, ‘PAGEIOLATCH_UP’, ‘PAGEIOLATCH_SH’, ‘OLEDB’ )
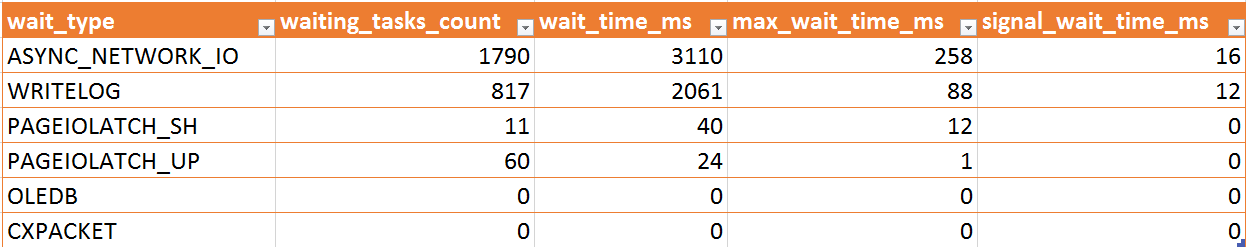
ORDER BY wait_time_ms DESC;
You can see from the results that ASYNC-NETWORK_IO has the highest overall wait time, measured in milliseconds. This was taken from a very lazy system that was recently restarted so the values have only been accumulating for a few minutes. You can use the results to further isolate where the performance bottleneck may be in your system.
It is also possible to reset the statistics manually as well with a simple DBCC command:
DBCC SQLPERF (N’sys.dm_os_wait_stats’, CLEAR);
This is sometimes a favorable option when you are to get a baseline from a certain point in time.
Getting the information you need is the first step and there are literally hundreds of variations of the sample query available to show you overall highest percentages, current versus historic statistics and in future version of SQL Server will even let you see the wait statistics at individual point in the execution plan of each query in the Query Store which you can read more about here. https://blogs.msdn.microsoft.com/sqlserverstorageengine/2017/07/03/what-are-you-waiting-for-introducing-wait-stats-support-in-query-store/
Once you know what SQL Server is waiting on you can bring in the other tools at your disposal to help isolate the issue even further until you finally find the culprit.
Wait stats is one of several areas that SQLWatchmen’s Database Diagnostic Analysis reports on when checking the health of your servers. Schedule a diagnostic analysis today.