You know the old joke that goes, “A DBA walks into a bar, sees some friends at a couple of tables and asks if he can join them.”? Well, as DBAs we are used to dealing with tables. Whether the data comes from a log file, trace file, or XML, we want to turn it into a table. One reason the tabular format is perfect for DBAs is because once we can query a source, we can persist that data into a database. Once we have the data persisted, then we can accumulate it and finally analyze it over time. DBAs also like to have lots of choices of things to analyze. Extended Events, which is a feature in SQL Server that has been around for many releases, provides a seemingly endless amount of choices of events that occur for a DBA to analyze, such as gathering query performance data. But unfortunately for the DBA, saving the captured events directly to a database for further analysis is not a default option.
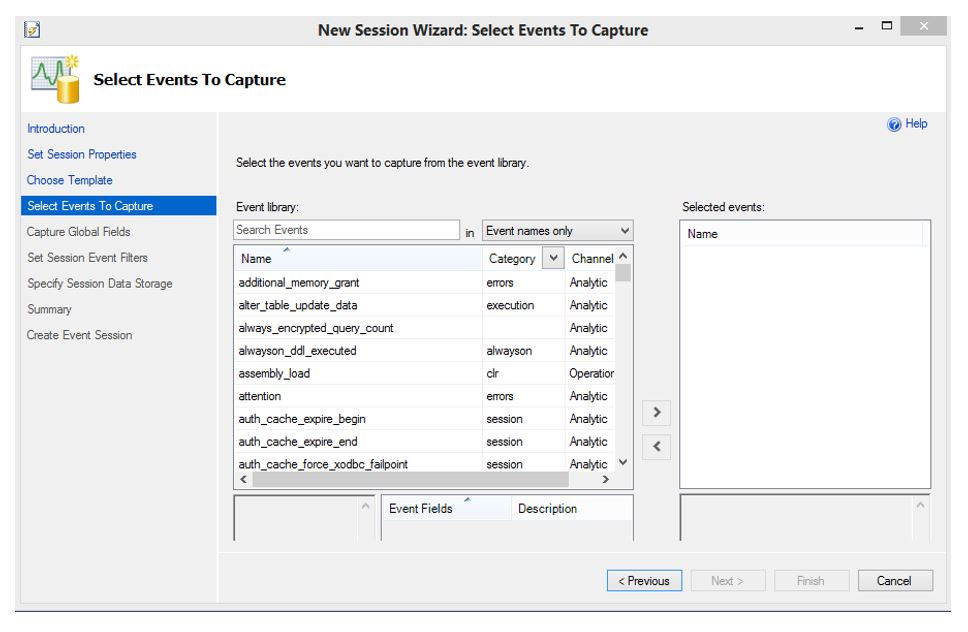
Extended Events have come a long way over the past versions of SQL Server. In early releases DBAs would have to write scripts to setup Extended Events sessions but these days there is full UI support in Management Studio and, of course, there is even a wizard to make it even easier.
Capturing Extended Events
I am not going to spend much time setting up a session here, but suffice it to say after you name your session, choose the events you want to capture and perhaps add a filter, you are done. Oh, and of course you will want to decide where to store the events.
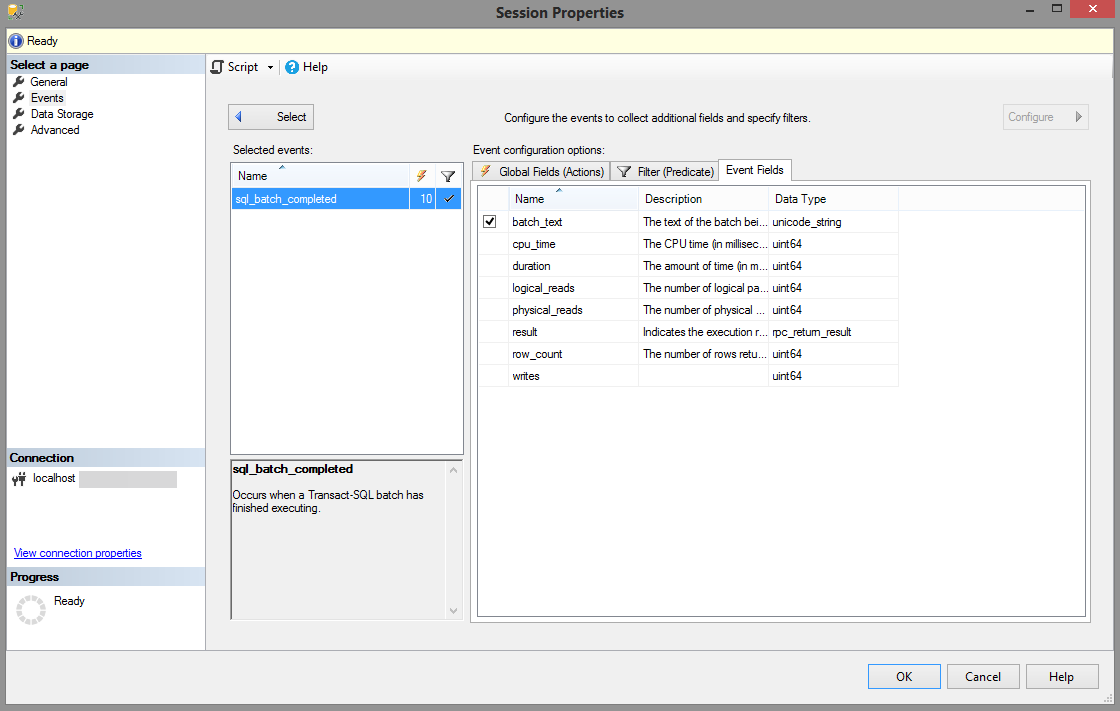
The sample session used here for directly querying the session data to a table, is capturing sql_batch_completed, which contains an excellent amount of useful data to analyze, such as client_hostname, client_app_name and several measures like row_count, logical_reads and cpu_time.
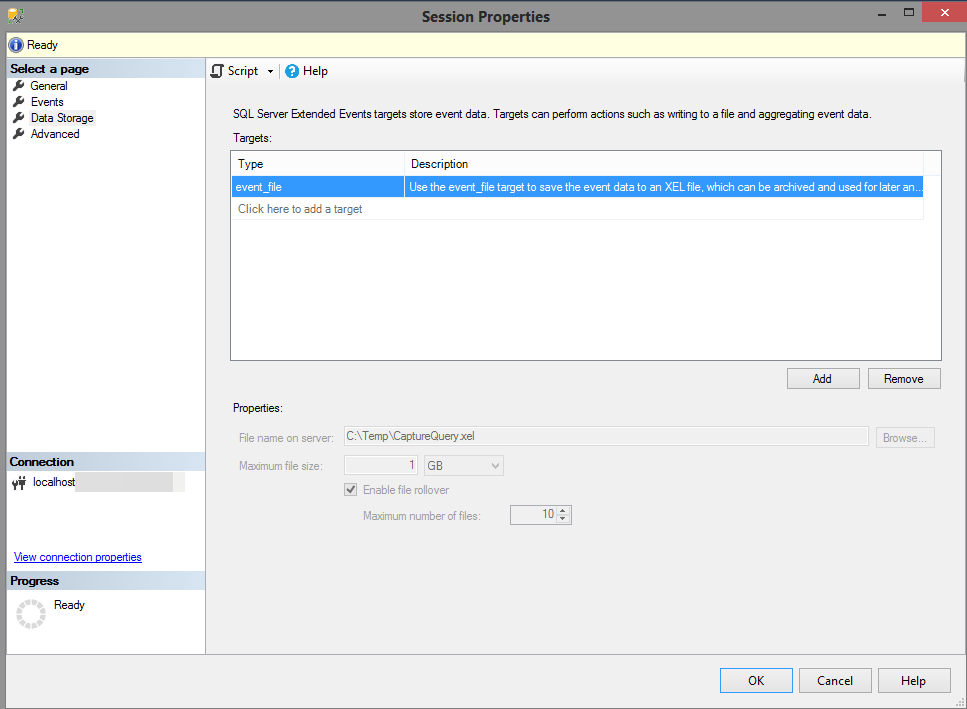
The most important part of the setup is to choose where to store the captured events. In this case, the events are captured to an event_file target with the maximum size of 1 GB and 10 possible rollover files. Here the session will write to a CaptureQuery.xel file on C:Temp.
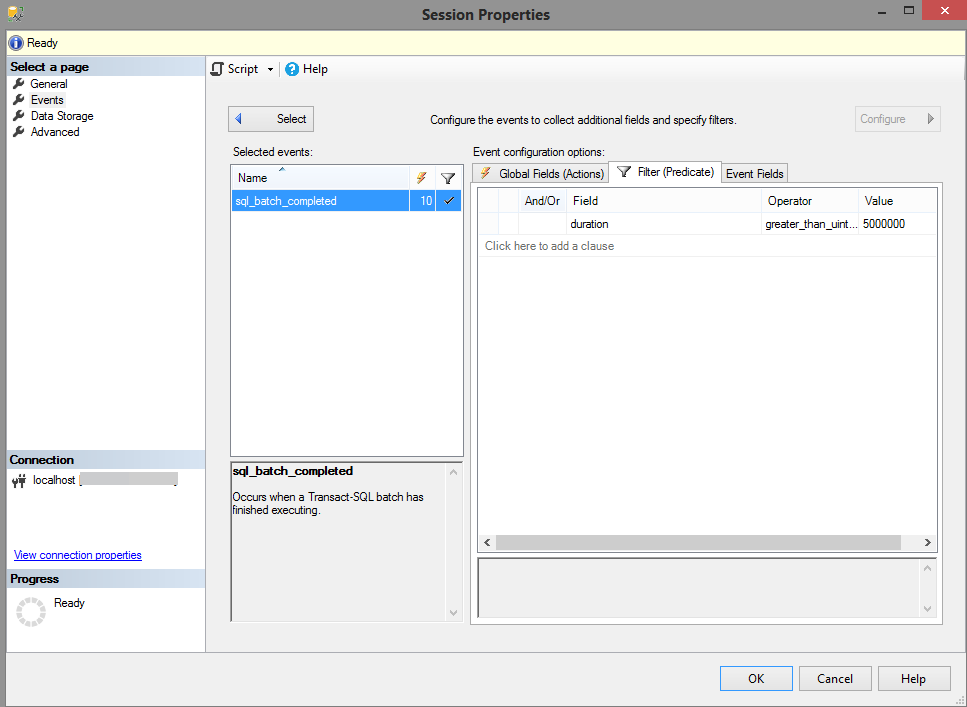
This may seem like a lot of data, and it certainly can be over time, especially if you are capturing every single query that runs against your SQL Server instance. Applying a filter to capture only queries that run over a specified duration can help. Just remember that the duration is measured in microseconds, not milliseconds so a query that runs 5 seconds will be 5000000 microseconds. If a query runs for more than 5 seconds and uses an excessive amount of CPU, for example, it may be a candidate for performance tuning, especially if it is executed hundreds of times per day.
Viewing The Extended Events Capture File
With the session setup and running, the events start streaming into the first created capture file and it is now possible to write the query to turn this data into a table. It is important to note that there is an event session viewer available in SSMS and it does a pretty good job of displaying, filtering and aggregating Extended Event data in its own right, and while it is somewhat in tabular format, it does not meet our need for accessing the data from other analytics tools like Power BI or Excel. We need a real table for that. Enter the function: sys.fn_xe_file_target_read_file.
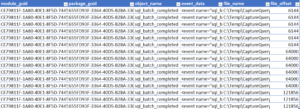
The first file that is created in the Temp folder is prefaces with the name of the Extended Event, QueryCapture and is named CaptureQuery_0_131449120638070000.xel. All that is required is to paste that file name into a T-SQL query that uses the sys.fn_xe_file_target_read_file function:
SELECT *
FROM sys.fn_xe_file_target_read_file(N’C:TempCaptureQuery_0_131449120638070000.xel’, NULL, NULL, NULL) entries;
And the results are in a table just the way we wanted:
Actually while the results are certainly tabular, all of the pertinent information is buried in the event_data field, which is XML. That data will need to be further extracted to be useful. Querying the XML values requires using XQuery and can be a little tricky if you are unaccustomed to the format. Fortunately, once you understand extracting one value, the rest are easy.
Querying Extended Events XML event_data
The first thing to understand is that in order to use Xquery, you need to have an XML result set and this requires converting the event_data field to XML:
SELECT cast(event_data AS XML) AS ED FROM sys.fn_xe_file_target_read_file(N’C:TempCaptureQuery_0_131474607840850000.xel’, NULL, NULL, NULL)
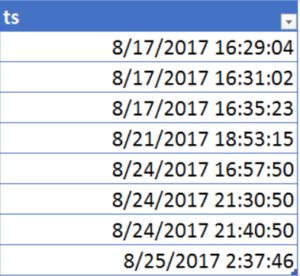
Now it is possible to query the XML directly using the value() method. The first example extracts the timestamp value from the “event” node.
SELECT
ED.value(N'(event/@timestamp)[1]’, N’datetime’) AS ts
FROM
(
SELECT CAST(event_data AS XML) AS ED
FROM sys.fn_xe_file_target_read_file(N’C:TempCaptureQuery_0_131474607840850000.xel’, NULL, NULL, NULL)
) A
And the results:
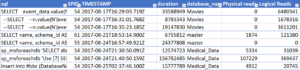
From here it is just a matter of grabbing the other values you are interested in, like CPU, Login and duration.
SELECT ED.value(N'(event/@timestamp)[1]’, N’datetime’) AS ts,
ED.value(‘(event/action[@name=”nt_username”]/value)[1]’, N’nvarchar(max)’) AS [Login],
ED.value(N'(event/action[@name=”sql_text”]/value)[1]’, N’nvarchar(max)’) AS [sql],
ED.value(N'(event/action[@name=”session_id”]/value)[1]’, N’int’) AS SPID,
ED.value(‘(event/@timestamp)[1]’, ‘varchar(50)’) AS [TIMESTAMP],
ED.value(‘(event/data[@name=”duration”]/value)[1]’, ‘int’) AS duration,
ED.value(‘(event/action[@name=”database_name”]/value)[1]’, N’nvarchar(max)’) AS database_name,
ED.value(‘(event/data[@name=”physical_reads”]/value)[1]’, ‘int’) AS [Physical reads],
ED.value(‘(event/data[@name=”logical_reads”]/value)[1]’, ‘int’) AS [Logical Reads],
ED.value(‘(event/data[@name=”row_count”]/value)[1]’, ‘int’) AS [Row Count],
ED.value(‘(event/data[@name=”cpu_time”]/value)[1]’, ‘int’) AS CPU
FROM
(
SELECT CAST(event_data AS XML) AS ED
FROM sys.fn_xe_file_target_read_file(N’C:Temp
And now a sampling of the field results are in a table that can be analyzed:
Extended Events Are The Future
Extended Events will one day fully replace the deprecated Profiler and you can see from the example above, this is the same type of data that you would expect to get from a Profiler trace. The difference here is that you can get so much more information with Extended Events. The data that you collect with Extended Event sessions can be used for troubleshooting, monitoring, alerting and baselining the SQL instances that DBAs use every day. With a few quick steps to create a query to read its native XML, it is possible to use Extended Events data in a way that is familiar and favored by the DBA.